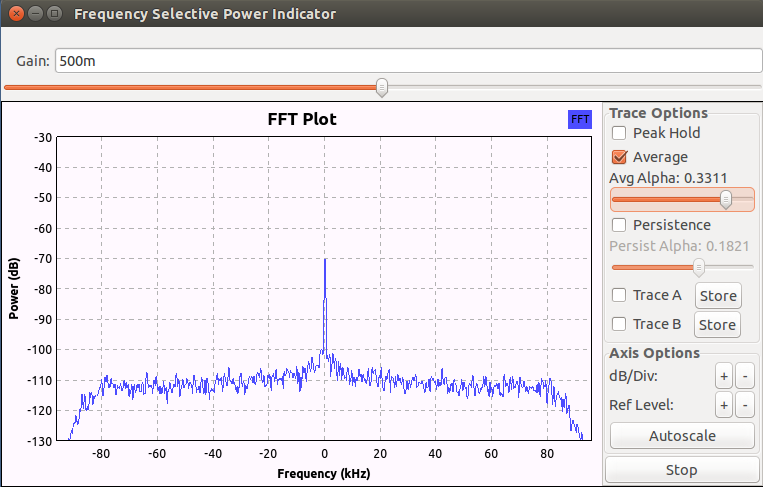
This SDR project is a workbench tool for circuit tuning and relative power measurements at microwave frequencies. This SDR receiver functions as a simplified, single purpose, spectrum analyzer that is useful for working with microwave circuits. These same DSP components constitute an elemental SDR receiver and are discussed under DSP Projects here: DSP for an Elemental Receiver
Why a frequency selective power indicator? Microwave circuits are typically tuned to a narrow range of frequencies or, in some situations, to a specific target frequency. The microwave device under test often has multiple RF signals in the output. The uncertainty of identifying the target frequency, among the many signals otherwise present in the RF circuit under test, is largely eliminated with a frequency selective power indicator. Despite the potential presence of harmonics, fundamental signal leakage, and other spurious RF signals at the input, a frequency selective power indicator, tuned to the desired signal frequency, will display only the desired signal’s amplitude. One can tune with greater confidence.
The front end of the SDR receiver is typically ‘wide open’, unfiltered for RF. All of the RF signals present at the receiver input are digitized to be processed by the receiver. For this application, the baseband DSP limits the receiver displayed bandwidth such that only the desired signal to be displayed. The approach with a ‘wide open’ SDR front end and baseband filtering has it’s limits. In practice, the result is a simple and useful tool for the experimenter. The displayed frequency is quite accurate, a function of the combined native SDR RFIC synthesizer and SDR master clock characteristics.
What is a frequency selective power indicator? An SDR based frequency selective power indicator is nothing more than a limited purpose tunable SDR receiver with a signal amplitude indicator. In other words a very narrow band spectrum analyzer with an FFT Sink panadapter output display. Such a receiver is a useful microwave workbench tool for tuning filter and mixer circuits, and for quantifying gain or loss in RF circuits. A relatively simple GNU Radio DSP flow graph, coupled with suitable SDR, (hardware for which a GNU Radio driver exists), implements a frequency selective power indicator. The range of usable SDR hardware for this project includes the inexpensive RTL SDR as well as the more advanced SDR hardware described previously.:
In contrast, broadband power meters register and sum all of the RF power at all the frequencies present at the sensor input. There is no filtering. Harmonics, fundamental signal leakage, and spurious signals all contribute to the total power measured with these broadband power meters. With this type of power meter, it is not always certain which signal is being affected by the circuit tuning and alignment. This approach works satisfactorily for many tuning operations while fraught with uncertainty in other situations, e.g.tuning for multiplier output frequencies..
Power indicator verses a power meter: This project describes a ‘power indicator’ for relative power measurement and not a ‘power meter’ with the calibrated power measuring capability. The SDR receiver hardware is designed to function as a sensitive low noise receiver that detects small signals received from an antenna. That said, the RF power levels in typical microwave circuits are much larger than signals from an antenna: 0 to +10 dBm for LO’s, +10 to +30 dBm output for entry level transceiver boards, -30 to -15 dBm for mixer IF outputs. A typical power meter is built to operate and measure at these higher power levels. A power indicator based on a sensitive receiver must be scaled to accommodate higher power levels. This scaling can be accomplished by adding a suitable attenuator to the SDR receiver RF input or by loose coupling of the receiver to the circuit under test. A true power meter must have traceable amplitude calibration. Suitable signals for calibration purposes are not always available on the microwave workbench. The bottom line is that this SDR receiver project will provide a simple and reliable means for relative power measurement.
How does the power indicator work in practice? Tuning of a microwave circuit under test is typically performed at a known RF frequency, e.g the desired output frequency of a multiplier circuit. That desired frequency is entered in the Frequency parameter field of the SDR Source block. The receiver input is loosely coupled, or directly coupled via a suitable attenuator to the circuit under test. The received signal, centered in the FFT display, is the desired signal. Spurious signals, alias signals, and any undesired signals are either not visible or not centered in the FFT display. No demodulation is possible with this simple receiver DSP.
The frequency response, amplitude dynamic range and sensitivity are determined entirely by the SDR receiver hardware used in the implementation. The quite useful RTL SDR covers frequencies from about 60 MHz to 2.1 GHz with an approximate 48 dB dynamic range. More advanced SDR hardware, such as the Ettus B100, can cover the 50 MHz to 6 GHz frequency range with about 72 dB of dynamic range. It is important to scale the RF signal input level to place the signal within the dynamic range of the SDR receiver hardware by adjustments to the input coupling or attenuation .
The GNU Radio flow graph for the elemental SDR receiver DSP is pictured below. Note the three DSP blocks: the Source block (the SDR receiver hardware), the Rational Resampler, and the FFT Sink (the output indicator). The Sample Rate is set for an arbitrary value of 150000 S/sec. The Rational Resampler reduces the sample rate to the FFT Sink and hence reduces the bandwidth of the FFT Sink display. In this manner, the Source output is filtered to display only the desired frequency to be measured.
The Operating GUI for this project is minimal. Only the receiver gain adjustment and the FFT display and it’s associated display functions are visible in the GUI.

The .grc file for this project is here: DSP for an Elemental Receiver