GNU Radio DSP can be configured in simulation mode and in the SDR mode to provide useful test and measurement tools for education and for DSP design.
Stimulus Response Testing using a DSP Noise Source
The broadband Noise Source DSP block can be included in a basic stimulus-response test flow graph to measure the baseband frequency response of DSP systems. Using the flowgraph in a simulation, input broadband noise from the Noise Source DSP block into the circuit under test, and output the data stream to the indicator of choice, commonly an FFT display. The uses of this technique are limited only by your imagination.
Below is an flow graph example of how the Noise Source principle is used to measure the bandpass characteristics of a Complex Bandpass FFT Filter. In this example, the user can substitute the type of filter to be examined, i.e. low pass, band pass, etc. and can vary the cutoff frequencies by adding WX GUI Slider blocks to vary the filter parameters. See: How To: link Control blocks with DSP blocks/ The output indicator is a WX GUI FFT Sink display.
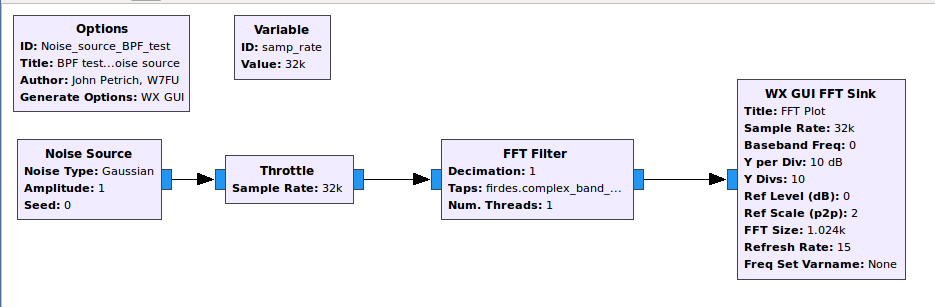
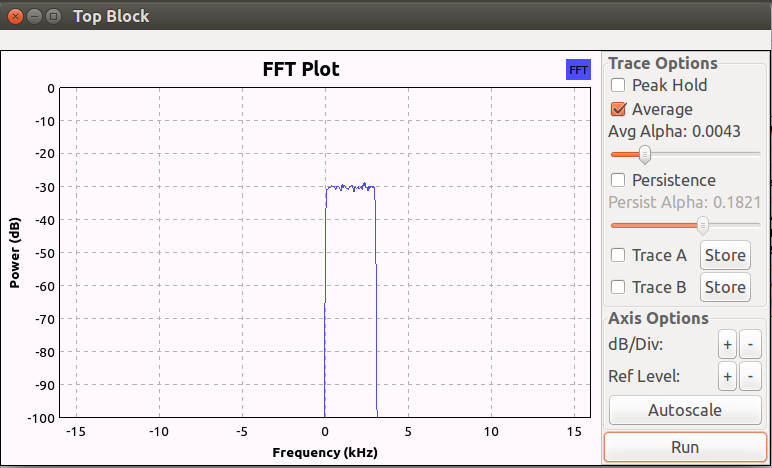
The USB output of the complex filter is shown in the panadapter display of the WX GUI FFT Sink. The WX GUI FFT displays the -16 kHz to 16 kHz (lower and upper sidebands centered on 0) spectrum with the 3 kHz USB filter response outlined by the noise.
The .grc flow graph file for this example can be downloaded here: Noise source .grc file.grc The download procedure is described here: Downloading .grc files
Measuring Receiver using SDR Receiver Hardware
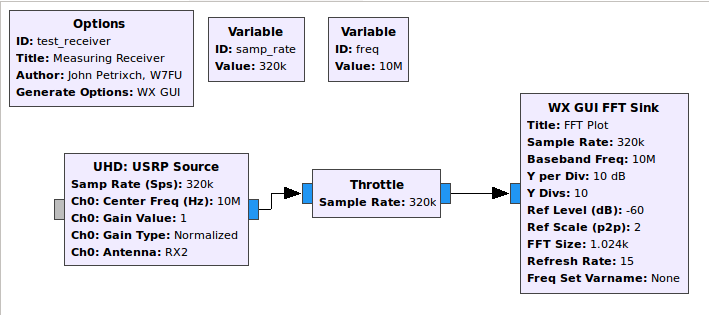
A receiver DSP can be used with SDR suitable receiver hardware to monitor and measure signal source and transmitter outputs in a variety situations. A very simple receiver DSP implemented with a SDR receiver Source block that outputs directly to a WX GUI FFT Sink. Tuning the SDR Source to the frequency of the signal being measured results in a display on the panadapter screen that could be used to interpret frequency, spurious signal, and amplitude information.
In this example flowgraph, the SDR receiver Source block receive frequency was arbitrarily chosen as 10 MHz. The frequency of 10 MHz is displayed in the Variable block at the top of the workspace. The frequency value can be set to any desired value with in the range of the SDR receiver hardware being used. The frequency span in this example is limited to 320000 kHz by the samp_rate of 320000 S/s. For a wider frequency span width, the samp-rate can be increased to a point that stays with in the samp_rate bandwidth permitted by your SDR device.
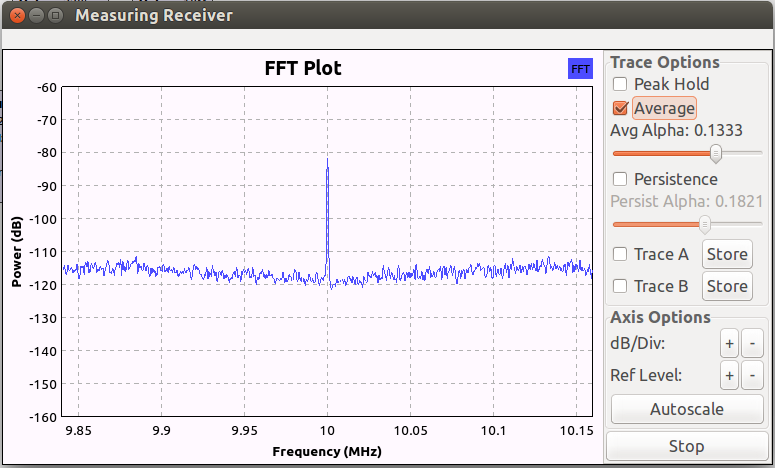
A 10 MHz signal was applied to the antenna input of the SDR receiver. When the flowgraph is executed, the Operating GUI appears on the screen. Note the 10 MHz signal displayed on frequency in the panadapter display.
The .grc file for this example is here: Measuring Receiver.grc
A receiver with the appropriate DSP demodulator, (NBFM, SSB, CW, etc.) can be used to examine the modulation quality of a transmitter by listening to the SDR audio output or visually monitoring the audio with a WX GUI Sink. Any receiver flowgraph can be used for this purpose. Specific examples won’t be described here. As an example of a possible application of this technique is to adjust the transmitter modulation as necessary to get satisfactory modulation as determined by listening to the measuring receiver output.
Signal Source using SDR Transmitter Hardware
A simple SDR transmitter DSP when linked to a suitable SDR transmitter hardware can function as a signal source for receiver testing among other uses. For example microwave receiver testing and calibration, can use the harmonics of a VHF/UHF signal source provide excellent microwave weak signals. A particular instance, a microwave receiver tuned to 47.088 GHz, the calling frequency for the 47 GHz band, will detect the 10th harmonic of a 4.788 GHz SDR signal source useful for tuning and frequency calibration purposes. The SDR transmits the desired output via it’s output / transmit port.
This flowgraph is quite simple in concept, but a bit more complex due to the control variables for signal amplitude and coarse and fine tuning frequency control and ‘on’ and ‘off’ function. This flowgraph is tailored to output signals at microwave frequencies from a microwave capable SDR. The flowgraph parameters can be adjusted to any frequency in the spectrum compatible with the SDR transmitter in use..
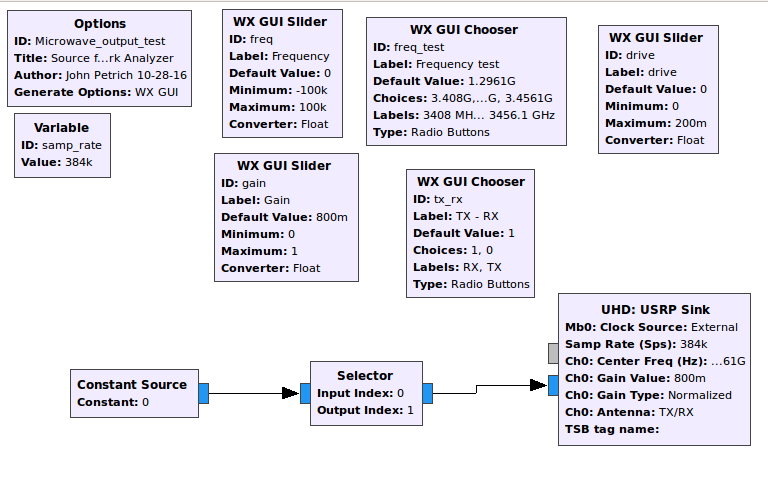
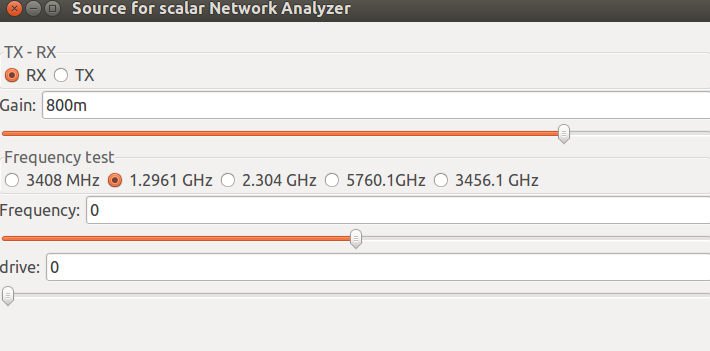
When the flowgraph is executed the Operating GUI appears. Note the buttons to turn the signal source “off” and “on” labelled as RX and TX. The frequency range buttons and the Frequency tune slider change the output frequencies. Those frequency value parameters can be customized by editing the appropriate DSP control box parameters. The output amplitude is adjusted by the Gain slider control.
The .grc file for this example is available for download here: Signal generator.grc
Link to Terms and Abbreviations: Terms and Abbreviations:
Link to Home Page: Home Page